Here are the essential concepts you must grasp in order to answer the question correctly.
Standardized Test Statistic (t)
A standardized test statistic, such as t, is used in hypothesis testing to determine how far a sample mean is from the population mean in terms of standard errors. It is calculated by taking the difference between the sample mean and the population mean, divided by the standard error of the mean. The value of t helps assess whether to reject the null hypothesis based on its position relative to critical values.
Recommended video:
Step 2: Calculate Test Statistic
Null Hypothesis (H0)
The null hypothesis (H0) is a statement that there is no effect or no difference, and it serves as the default assumption in hypothesis testing. Researchers aim to gather evidence against H0 to support an alternative hypothesis (H1). The decision to reject H0 is based on the calculated test statistic and its comparison to critical values from the relevant statistical distribution.
Recommended video:
Rejection Region
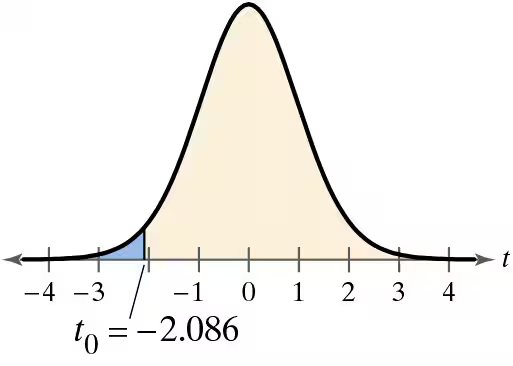
The rejection region is the area in the tails of the probability distribution where, if the test statistic falls, the null hypothesis is rejected. In a t-distribution, this region is determined by the significance level (alpha) and the degrees of freedom. For the given t value of -2.096, if it falls within the rejection region (to the left of -2.086 in this case), it indicates sufficient evidence to reject the null hypothesis.
Recommended video: