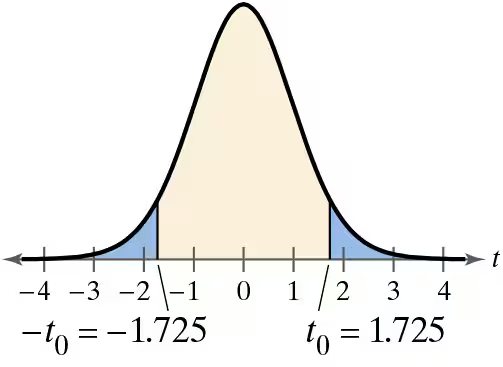
Graphical Analysis In Exercises 9–12, state whether each standardized test statistic t allows you to reject the null hypothesis. Explain.
a. t = -1.755
Verified step by step guidance
1
Identify the critical values from the graph, which are given as $-1.725$ and $1.725$. These values mark the boundaries of the rejection regions in the tails of the t-distribution.
Determine the rejection regions: any t-value less than $-1.725$ or greater than $1.725$ falls into the rejection region, meaning the null hypothesis would be rejected in those cases.
Compare the given test statistic $t = -1.755$ to the critical values. Since $-1.755$ is less than $-1.725$, it lies in the left rejection region.
Conclude that because the test statistic falls in the rejection region, there is sufficient evidence to reject the null hypothesis at the given significance level.
Remember that this conclusion depends on the significance level associated with the critical values, which is typically set before the test (commonly 0.05 for two-tailed tests).
Verified video answer for a similar problem:
This video solution was recommended by our tutors as helpful for the problem above
Video duration:
2m
Play a video:
Was this helpful?
Key Concepts
Here are the essential concepts you must grasp in order to answer the question correctly.
Null Hypothesis and Alternative Hypothesis
The null hypothesis (H0) is a statement of no effect or no difference, which we test against the alternative hypothesis (Ha). In hypothesis testing, we use sample data to decide whether to reject H0 in favor of Ha, based on the evidence provided by the test statistic.
Critical values define the boundaries of rejection regions in a hypothesis test. If the test statistic falls into these regions (beyond the critical values), we reject the null hypothesis. The image shows critical values at ±1.725, marking the cutoff points for rejecting H0 at a given significance level.
The t-value measures how many standard errors the sample statistic is from the null hypothesis value. Comparing the calculated t-value to critical values helps determine if the observed data is statistically significant. Here, t = -1.755 lies beyond the critical value -1.725, indicating rejection of H0.