Back
BackProblem 8.1.15
Testing the Difference Between Two Means In Exercises 15–24, (a) identify the claim and state Ho and Ha, (b) find the critical value(s) and identify the rejection region(s), (c) find the standardized test statistic z, (d) decide whether to reject or fail to reject the null hypothesis, and (e) interpret the decision in the context of the original claim. Assume the samples are random and independent, and the populations are normally distributed.
Braking Distances To compare the dry braking distances from 60 to 0 miles per hour for two makes of automobiles, a safety engineer conducts braking tests for 16 compact SUVs and 11 midsize SUVs. The mean braking distance for the compact SUVs is 131.8 feet. Assume the population standard deviation is 5.5 feet. The mean braking distance for the midsize SUVs is 132.8 feet. Assume the population standard deviation is 6.7 feet. At α=0.10 , can the engineer support the claim that the mean braking distances are different for the two categories of SUVs? (Adapted from Consumer Reports)
Problem 8.1.5
Independent and Dependent Samples In Exercises 5– 8, classify the two samples as independent or dependent and justify your answer.
Sample 1: The maximum bench press weights for 53 football players
Sample 2: The maximum bench press weights for the same 53 football players after completing a weight lifting program
Problem 8.4.9
Young Adults In a survey of 3500 males ages 20 to 24 whose highest level of education is some college, but no bachelor’s degree, 80.2% were employed. In a survey of 2000 males ages 20 to 24 whose highest level of education is a bachelor’s degree or higher, 86.4% were employed. At α=0.01, can you support the claim that there is a difference in the proportion of those employed between the two groups? (Adapted from National Center for Education Statistics)
Problem 8.4.11
Seat Belt Use In a survey of 1000 drivers from the West, 934 wear a seat belt. In a survey of 1000 drivers from the Northeast, 909 wear a seat belt. At α=0.05, can you support the claim that the proportion of drivers who wear seat belts is greater in the West than in the Northeast? (Adapted from National Highway Traffic Safety Administration)
Problem 8.1.20
Testing the Difference Between Two Means In Exercises 15–24, (a) identify the claim and state Ho and Ha, (b) find the critical value(s) and identify the rejection region(s), (c) find the standardized test statistic z, (d) decide whether to reject or fail to reject the null hypothesis, and (e) interpret the decision in the context of the original claim. Assume the samples are random and independent, and the populations are normally distributed.
ACT English and Reading Scores The mean ACT English score for 120 high school students is 19.9. Assume the population standard deviation is 7.2. The mean ACT reading score for 150 high school students is 21.2. Assume the population standard deviation is 7.1. At α=0.10, can you support the claim that ACT reading scores are higher than ACT English scores? (Source: ACT, Inc.)
Problem 8.1.17
Test the claim about the difference between two population means and at the level of significance α. Assume the samples are random and independent, and the populations are normally distributed.
Claim: μ1=μ2, α=0.01, Assume (σ1)^2=(σ2)^2
Problem 8.1.2
Explain how to perform a two-sample z-test for the difference between two population means using independent samples with and known.
Problem 8.10
In Exercises 7–10, the statement represents a claim. Write its complement and state which is Ho and which is Ha.
μ≠2.28
Problem 8.1.21
Testing the Difference Between Two Means In Exercises 15–24, (a) identify the claim and state Ho and Ha, (b) find the critical value(s) and identify the rejection region(s), (c) find the standardized test statistic z, (d) decide whether to reject or fail to reject the null hypothesis, and (e) interpret the decision in the context of the original claim. Assume the samples are random and independent, and the populations are normally distributed.
Home Prices A real estate agency says that the mean home sales price in Casper, Wyoming, is the same as in Cheyenne, Wyoming. The mean home sales price for 35 homes in Casper is $349,237. Assume the population standard deviation is $158,005. The mean home sales price for 41 homes in Cheyenne is $435,244. Assume the population standard deviation is $154,716. At α=0.01, is there enough evidence to reject the agency’s claim? (Adapted from Realtor.com)
Problem 8.3.5
Test the claim about the mean of the differences for a population of paired data at the level of significance α. Assume the samples are random and dependent, and the populations are normally distributed.
Claim: μd≤0 , α=0.10, Sample statistics: d̄ =6.5, sd=9.54, n=16
Problem 8.4.3
In Exercises 3 – 6, determine whether a normal sampling distribution can be used. If it can be used, test the claim about the difference between two population proportions and at the level of significance . Assume the samples are random and independent.
Claim: p1≠p2, α=0.01
Sample statistics: x1=35, n1=70, and x2=36, n2=60
Problem 8.2.26
Constructing Confidence Intervals for μ1-μ2. When the sampling distribution for x̅1-x̅2 is approximated by a t-distribution and the populations have equal variances, you can construct a confidence interval for μ1-μ2, as shown below.
Construct the indicated confidence interval for μ1-μ2 . Assume the populations are approximately normal with equal variances.
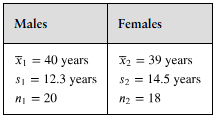
10K Race
To compare the mean ages of male and female participants in a 10K race, you randomly select several ages from both sexes. The results are shown below. Construct a 95% confidence interval for the difference in mean ages of male and female participants in the race. (Adapted from Great Race)
Problem 8.2.9
Test the claim about the difference between two population means and at the level of significance α. Assume the samples are random and independent, and the populations are normally distributed.
Claim: μ1=μ2, α=0.01, Assume (σ1)^2=(σ2)^2
Sample statistics:
x̅1=33.7, s1=3.5 , n1=12 and x̅2=35.5 , s2=2.2 , n2=17
Problem 8.1.16
Testing the Difference Between Two Means In Exercises 15–24, (a) identify the claim and state Ho and Ha, (b) find the critical value(s) and identify the rejection region(s), (c) find the standardized test statistic z, (d) decide whether to reject or fail to reject the null hypothesis, and (e) interpret the decision in the context of the original claim. Assume the samples are random and independent, and the populations are normally distributed.
Bed-in-a-Box To compare customer satisfaction with mattresses that are delivered compressed in a box and traditional mattresses, a researcher randomly selects 30 ratings of mattresses in boxes and 30 ratings of traditional mattresses. The mean rating of mattresses in boxes is 68.7 out of 100. Assume the population standard deviation is 6.6. The mean rating of traditional mattresses is 70.9 out of 100. Assume the population standard deviation is 5.6. At α=0.01, can the researcher support the claim that the mean rating of traditional mattresses is greater than the mean rating of mattresses in a box? (Adapted from Consumer Reports)
Problem 8.2.12
Test the claim about the difference between two population means and at the level of significance α. Assume the samples are random and independent, and the populations are normally distributed.
Claim: μ1>μ2, α=0.01, Assume (σ1)^2≠(σ2)^2
Sample statistics:
x̅1=52, s1=4.8, n1=32 and x̅2=50, s2=1.2, n2=40
Problem 8.4.23
Constructing Confidence Intervals for p1-p2 You can construct a confidence interval for the difference between two population proportions p1-p2 by using the inequality below.
In Exercises 23–26, construct the indicated confidence interval for p1-p2. Assume the samples are random and independent.
Students Planning to Study Visual and Performing Arts In a survey of 10,000 students taking the SAT, 7% were planning to study visual and performing arts in college. In another survey of 8000 students taken 10 years before, 8% were planning to study visual and performing arts in college. Construct a 95% confidence interval for p1-p2, where p1 is the proportion from the recent survey and p2 is the proportion from the survey taken 10 years ago. (Adapted from College Board)
Problem 8.1.4
What conditions are necessary in order to use the z-test to test the difference between two population means?
Problem 8.3.23
Constructing Confidence Intervals for μd To construct a confidence interval for μd , use the inequality below.
Construct the indicated confidence interval for μd . Assume the populations are normally distributed.
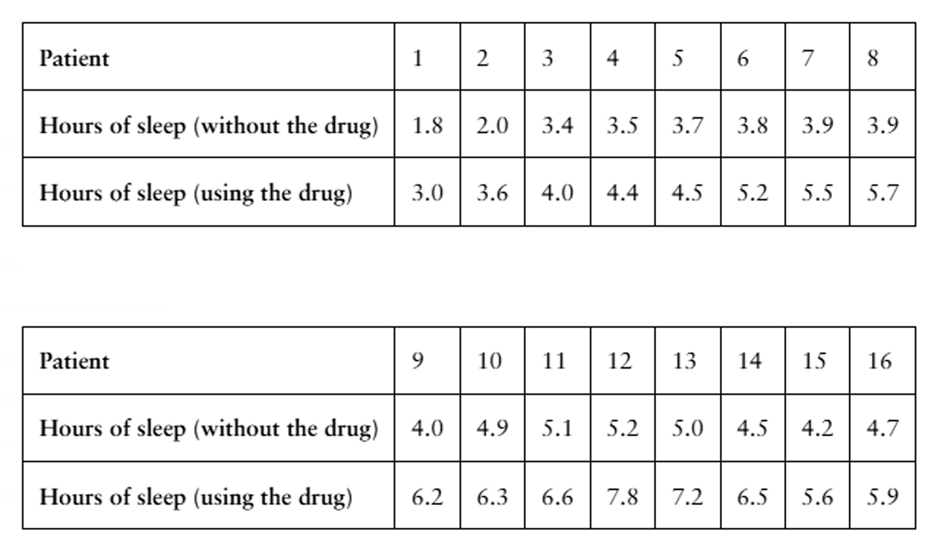
[APPLET] Drug Testing A sleep disorder specialist wants to test the effectiveness of a new drug that is reported to increase the number of hours of sleep patients get during the night. To do so, the specialist randomly selects 16 patients and records the number of hours of sleep each gets with and without the new drug. The table shows the results of the two-night study. Construct a 90% confidence interval for μd.
Problem 8.1.27
Testing a Difference Other Than Zero Sometimes a researcher is interested in testing a difference in means other than zero. In Exercises 27 and 28, you will test the difference between two means using a null hypothesis of Ho: μ1-μ2=k, Ho: μ1-μ2>=k or Ho: μ1-μ2<=k . The standardized test statistic is still
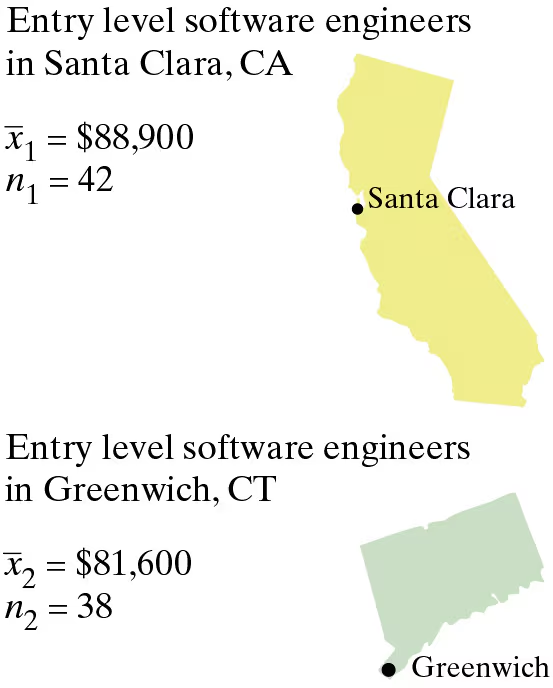
Software Engineer Salaries Is the difference between the mean annual salaries of entry level software engineers in Santa Clara, California, and Greenwich, Connecticut, more than $4000? To decide, you select a random sample of entry level software engineers from each city. The results of each survey are shown in the figure at the left. Assume the population standard deviations are σ1=$14,060 and σ2=$13,050 . At α=0.05, what should you conclude? (Adapted from Salary.com)
Problem 8.1.8
Independent and Dependent Samples In Exercises 5– 8, classify the two samples as independent or dependent and justify your answer.
Sample 1: The commute times of 10 workers when they use their own vehicles
Sample 2: The commute times of the same 10 workers when they use public transportation
Problem 8.2.11
Test the claim about the difference between two population means and at the level of significance α. Assume the samples are random and independent, and the populations are normally distributed.
Claim: μ1≤μ2, α=0.05, Assume (σ1)^2≠(σ2)^2
Sample statistics:
x̅1=2410, s1=175, n1=13 and x̅2=2305, s2=52, n2=10
Problem 8.3.8
Test the claim about the mean of the differences for a population of paired data at the level of significance α. Assume the samples are random and dependent, and the populations are normally distributed.
Claim: μd≠0 , α=0.10, Sample statistics: d̄ =-1, sd=2.75, n=20
Problem 8.2.13
Testing the Difference Between Two Means, (a) identify the claim and state H0 and Ha , (b) find the critical value(s) and identify the rejection region(s), (c) find the standardized test statistic t, (d) decide whether to reject or fail to reject the null hypothesis, and (e) interpret the decision in the context of the original claim. Assume the samples are random and independent, and the populations are normally distributed.
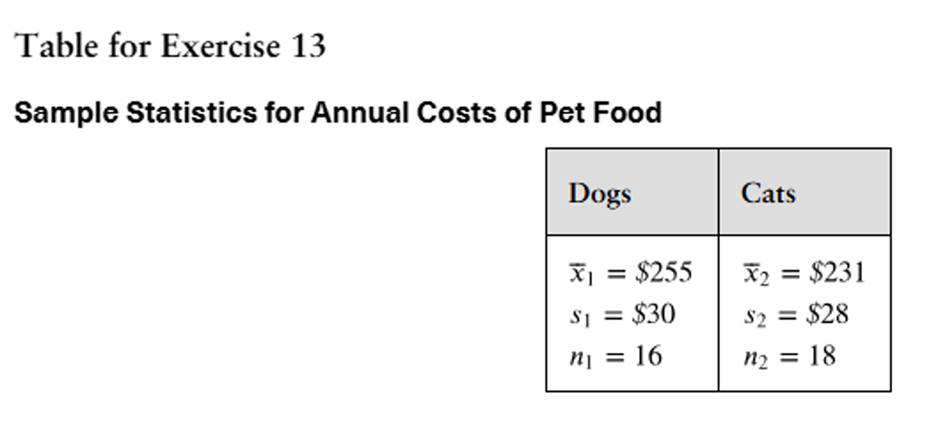
Pet Food
A pet association claims that the mean annual costs of food for dogs and cats are the same. The results for samples of the two types of pets are shown at the left. At , α=0.10 can you reject the pet association’s claim? Assume the population variances are equal. (Adapted from American Pet Products Association)
Problem 8.4.1
What conditions are necessary to use the z-test for testing the difference between two population proportions?
Problem 8.2.19
[APPLET] Tensile Strength
The tensile strength of a metal is a measure of its ability to resist tearing when it is pulled lengthwise. An experimental method of treatment produced steel bars with the tensile strengths (in newtons per square millimeter) listed below.
Experimental Method:
391 383 333 378 368 401 339 376 366 348
The conventional method produced steel bars with the tensile strengths (in newtons per square millimeter) listed below.
Conventional Method:
362 382 368 398 381 391 400410 396 411 385 385 395 371
At , α=0.01 can you support the claim that the experimental method of treatment makes a difference in the tensile strength of steel bars? Assume the population variances are equal.
Problem 8.1.11
In Exercises 11 –14, test the claim about the difference between two population means and at the level of significance . Assume the samples are random and independent, and the populations are normally distributed.
Claim: μ1=μ2; α=0.1
Population statistics:σ1=3.4 and σ2=1.5
Sample Statistics: x̅1=16, n1=29, x̅2=14, n2=28
Problem 8.4.16
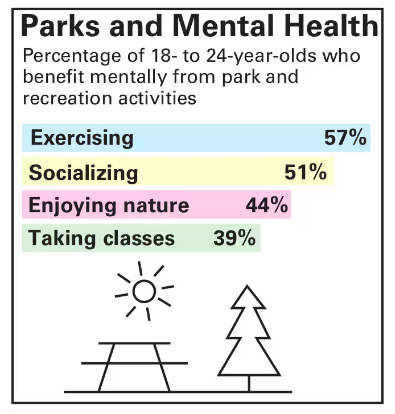
Parks and Mental Health In Exercises 13 –18, use the figure, which shows the percentages from a survey of two hundred 18- to 24-year-olds in the United States who say that various park and recreation activities have a positive impact on their mental health. (Adapted from National Recreation and Park Association)
Socializing and Taking Classes At α=0.05, can you support the claim that the proportion of 18- to 24-year-olds who benefit mentally from socializing in parks is different from the proportion who benefit mentally from taking classes in parks?
Problem 8.1.13
In Exercises 11 –14, test the claim about the difference between two population means and at the level of significance . Assume the samples are random and independent, and the populations are normally distributed.
Claim: μ1<μ2; α=0.05
Population statistics:σ1=75 and σ2=105
Sample Statistics: x̅1=2435, n1=35, x̅2=2432, n2=90
Problem 8.1.25
Getting at the Concept Explain why the null hypothesis Ho: μ1=μ2 is equivalent to the null hypothesis .Ho: μ1-μ2=0
Problem 8.6-8.2
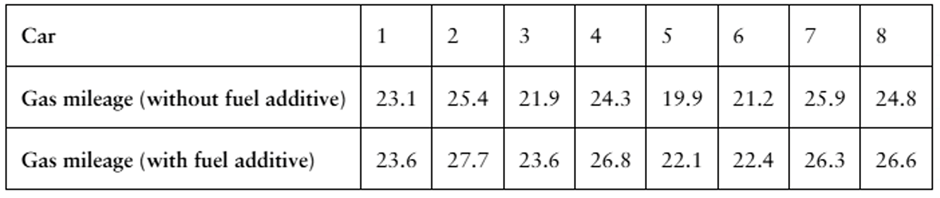
Gas Mileage The table shows the gas mileages (in miles per gallon) of eight cars with and without using a fuel additive. At α=0.10, is there enough evidence to conclude that the additive improved gas mileage? Assume the populations are normally distributed.