Back
BackProblem 8.C.13
An education organization claims that the mean SAT scores for male athletes and male non-athletes at a college are different. A random sample of 26 male athletes at the college has a mean SAT score of 1189 and a standard deviation of 218. A random sample of 18 male non-athletes at the college has a mean SAT score of 1376 and a standard deviation of 186. At α=0.05, can you support the organization’s claim? Interpret the decision in the context of the original claim. Assume the populations are normally distributed and the population variances are equal.
Problem 8.C6-8.1
In a survey of 4860 U.S. adults, 77% said they would date or have already dated someone whose religion was different from theirs. (Source: Pew Research Center)
Construct a 95% confidence interval for the proportion of U.S. adults who say they would date or have already dated someone whose religion was different from theirs.
Problem 8.CR.4
In Exercises 3 – 6, construct the indicated confidence interval for the population mean . Which distribution did you use to create the confidence interval?
c=0.95, x̅=3.46, s=1.63, n=16
Problem 8.CR.14
[APPLET] The annual earnings (in dollars) for 30 randomly selected locksmiths are shown below. Assume the population is normally distributed. (Adapted from Salary.com)
48,694 46,856 42,912 61,672 71,112 54,861
69,454 71,841 59,751 69,612 54,284 52,166
66,360 48,164 65,272 35,250 61,127 65,397
58,925 58,916 59,017 53,070 45,199 69,941
69,492 57,085 53,829 52,692 68,298 53,792
A researcher claims that the mean annual earnings for locksmiths is $55,000. At α=0.05, can you reject the researcher’s claim? Interpret the decision in the context of the original claim.
Problem 8.CR.6
In Exercises 3 – 6, construct the indicated confidence interval for the population mean . Which distribution did you use to create the confidence interval?
c=0.90, x̅=8.21, σ=0.62, n=8
Problem 8.CR.14a
[APPLET] The annual earnings (in dollars) for 30 randomly selected locksmiths are shown below. Assume the population is normally distributed. (Adapted from Salary.com)
48,694 46,856 42,912 61,672 71,112 54,861
69,454 71,841 59,751 69,612 54,284 52,166
66,360 48,164 65,272 35,250 61,127 65,397
58,925 58,916 59,017 53,070 45,199 69,941
69,492 57,085 53,829 52,692 68,298 53,792
Construct a 95% confidence interval for the population mean annual earnings for locksmiths.
Problem 8.CR.12a
The mean room rate for two adults for a random sample of 26 three-star hotels in Cincinnati has a sample standard deviation of $31. Assume the population is normally distributed. (Adapted from Expedia)
Construct a 99% confidence interval for the population variance.
Problem 8.Ch6-9.9
In Exercises 7–10, the statement represents a claim. Write its complement and state which is Ho and which is Ha.
σ=0.63
Problem 8.Q.1c
Take this quiz as you would take a quiz in class. After you are done, check your work against the answers given in the back of the book.For each exercise, perform the steps below.
c. Find the critical value(s) and identify the rejection region(s).
The mean score on a reading assessment test for 49 randomly selected male high school students was 279. Assume the population standard deviation is 41. The mean score on the same test for 50 randomly selected female high school students was 292. Assume the population standard deviation is 39. At α=0.05, can you support the claim that the mean score on the reading assessment test for male high school students is less than the mean score for female high school students? (Adapted from National Center for Education Statistics)
Problem 8.Q.1b
Take this quiz as you would take a quiz in class. After you are done, check your work against the answers given in the back of the book.For each exercise, perform the steps below.
b. Determine whether the hypothesis test is left-tailed, right-tailed, or two-tailed, and whether to use a z-test or a t-test. Explain your reasoning.
The mean score on a reading assessment test for 49 randomly selected male high school students was 279. Assume the population standard deviation is 41. The mean score on the same test for 50 randomly selected female high school students was 292. Assume the population standard deviation is 39. At α=0.05, can you support the claim that the mean score on the reading assessment test for male high school students is less than the mean score for female high school students? (Adapted from National Center for Education Statistics)
Problem 8.Q.3
Take this quiz as you would take a quiz in class. After you are done, check your work against the answers given in the back of the book.For each exercise, perform the steps below.
a. Identify the claim and state Ho and Ha
b. Determine whether the hypothesis test is left-tailed, right-tailed, or two-tailed, and whether to use a z-test or a t-test. Explain your reasoning.
c. Find the critical value(s) and identify the rejection region(s).
d. Find the appropriate standardized test statistic.
e. Decide whether to reject or fail to reject the null hypothesis.
f. Interpret the decision in the context of the original claim.
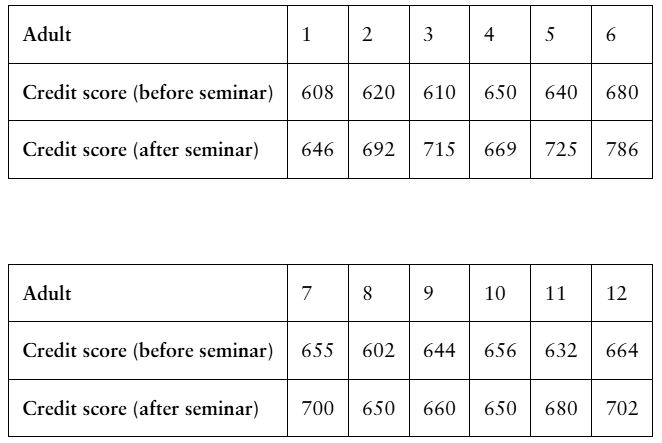
[APPLET] The table shows the credit scores for 12 randomly selected adults who are considered high-risk borrowers before and two years after they attend a personal finance seminar. At α=0.01, is there enough evidence to support the claim that the personal finance seminar helps adults increase their credit scores? Assume the populations are normally distributed.
Problem 8.Q.2
Take this quiz as you would take a quiz in class. After you are done, check your work against the answers given in the back of the book.For each exercise, perform the steps below.
a. Identify the claim and state Ho and Ha
b. Determine whether the hypothesis test is left-tailed, right-tailed, or two-tailed, and whether to use a z-test or a t-test. Explain your reasoning.
c. Find the critical value(s) and identify the rejection region(s).
d. Find the appropriate standardized test statistic.
e. Decide whether to reject or fail to reject the null hypothesis.
f. Interpret the decision in the context of the original claim.
A music teacher claims that the mean scores on a music assessment test for eighth grade students in public and private schools are equal. The mean score for 13 randomly selected public school students is 146 with a standard deviation of 49, and the mean score for 15 randomly selected private school students is 160 with a standard deviation of 42. At α=0.1, can you reject the teacher’s claim? Assume the populations are normally distributed and the population variances are equal. (Adapted from National Center for Education Statistics)
Problem 8.Q.1f
Take this quiz as you would take a quiz in class. After you are done, check your work against the answers given in the back of the book.For each exercise, perform the steps below.
f. Interpret the decision in the context of the original claim.
The mean score on a reading assessment test for 49 randomly selected male high school students was 279. Assume the population standard deviation is 41. The mean score on the same test for 50 randomly selected female high school students was 292. Assume the population standard deviation is 39. At α=0.05, can you support the claim that the mean score on the reading assessment test for male high school students is less than the mean score for female high school students? (Adapted from National Center for Education Statistics)
Problem 8.Q.1a
Take this quiz as you would take a quiz in class. After you are done, check your work against the answers given in the back of the book.For each exercise, perform the steps below.
a. Identify the claim and state Ho and Ha
The mean score on a reading assessment test for 49 randomly selected male high school students was 279. Assume the population standard deviation is 41. The mean score on the same test for 50 randomly selected female high school students was 292. Assume the population standard deviation is 39. (Adapted from National Center for Education Statistics)
Problem 8.R.16
In Exercises 11–16, test the claim about the difference between two population means μ1 and μ2 at the level of significance α. Assume the samples are random and independent, and the populations are normally distributed.
Claim: μ1> μ2; α=0.10. Assume (σ1)^2 ≠ (σ2)^2
Sample statistics: x̅1= 520, s1= 25, n1= 7 and x̅2= 500, s2= 55, n2= 6
Problem 8.R.24
In Exercises 23 and 24, (a) identify the claim and state Ho and Ha , (b) find the critical value(s) and identify the rejection region(s), (c) calculate d̄ and sd, (d) find the standardized test statistic t, (e) decide whether to reject or fail to reject the null hypothesis, and (f) interpret the decision in the context of the original claim. Assume the samples are random and dependent, and the populations are normally distributed.
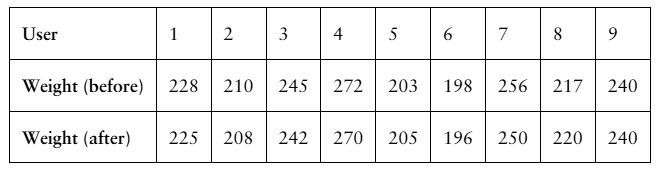
A physical fitness instructor claims that a weight loss supplement will help users lose weight after two weeks. The table shows the weights (in pounds) of 9 adults before using the supplement and two weeks after using the supplement. At α=0.10, is there enough evidence to support the physical fitness instructor’s claim?
Problem 8.R.3
In Exercises 1– 4, classify the two samples as independent or dependent and justify your answer.
Sample 1: The retail prices of 20 motorcycles
Sample 2: The retail prices of 20 minivans
Problem 8.R.20
In Exercises 19 –22, test the claim about the mean of the differences for a population of paired data at the level of significance α. Assume the samples are random and dependent, and the populations are normally distributed.
Claim: μd<0; α=0.10.
Sample statistics: d̄=3.2, sd=5.68, n=25
Problem 8.R.1
In Exercises 1– 4, classify the two samples as independent or dependent and justify your answer.
Sample 1: The heights of 37 children
Sample 2: The heights of the same 37 children after 1 year
Problem 8.R.22
In Exercises 19 –22, test the claim about the mean of the differences for a population of paired data at the level of significance α. Assume the samples are random and dependent, and the populations are normally distributed.
Claim: μd≠0; α=0.05.
Sample statistics: d̄=17.5, sd=4.05, n=37
Problem 8.R.5
In Exercises 5– 8, test the claim about the difference between two population means μ1 and μ2 at the level of significance α. Assume the samples are random and independent, and the populations are normally distributed.
Claim: μ1>μ2; α=0.05
Population statistics: σ1= 0.30 and σ2= 0.23
Sample statistics: x̅1 = 1.28, n1 = 96, and x̅2= 1.34, n2= 85
Problem 8.R.9
In Exercises 9 and 10, (a) identify the claim and state Ho and Ha , (b) find the critical value(s) and identify the rejection region(s), (c) find the standardized test statistic z, (d) decide whether to reject or fail to reject the null hypothesis, and (e) interpret the decision in the context of the original claim. Assume the samples are random and independent, and the populations are normally distributed.
A researcher claims that the mean sodium content of sandwiches at Restaurant A is less than the mean sodium content of sandwiches at Restaurant B. The mean sodium content of 22 randomly selected sandwiches at Restaurant A is 670 milligrams. Assume the population standard deviation is 20 milligrams. The mean sodium content of 28 randomly selected sandwiches at Restaurant B is 690 milligrams. Assume the population standard deviation is 30 milligrams. At α=0.05, is there enough evidence to support the claim?
Problem 8.R.29
In Exercises 29 and 30, (a) identify the claim and state Ho and Ha, (b) find the critical value(s) and identify the rejection region(s), (c) find the standardized test statistic z, (d) decide whether to reject or fail to reject the null hypothesis, and (e) interpret the decision in the context of the original claim. Assume the samples are random and independent.
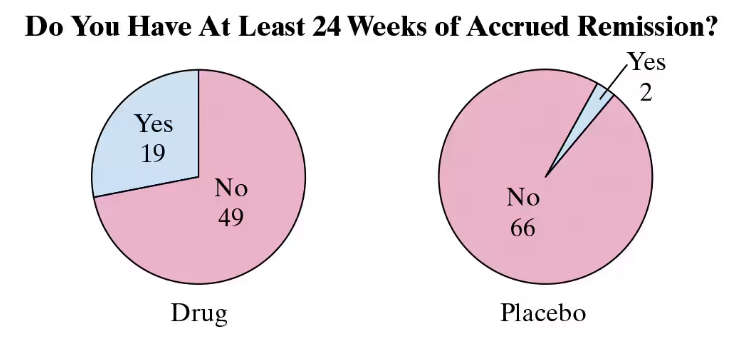
A medical research team conducted a study to test the effect of a drug used to treat a type of inflammation. In the study, 68 subjects took the drug and 68 subjects took a placebo. The results are shown below. At α=0.05, can you reject the claim that the proportion of subjects who had at least 24 weeks of accrued remission is the same for the two groups? (Source: The New England Journal of Medicine)
Problem 8.RE.12
In Exercises 11–16, test the claim about the difference between two population means μ1 and μ2 at the level of significance α. Assume the samples are random and independent, and the populations are normally distributed.
Claim: μ1< μ2; α=0.10. Assume (σ1)^2 ≠ (σ2)^2
Sample statistics: x̅1=0.015, s1=0.011, n1= 8 and x̅2=0.019, s2=0.004, n2= 6
Problem 8.RE.18e
In Exercises 17 and 18, (e) interpret the decision in the context of the original claim. Assume the samples are random and independent, and the populations are normally distributed.
A real estate agent claims that there is no difference between the mean household incomes of two neighborhoods. The mean income of 12 randomly selected households from the first neighborhood is $52,750 with a standard deviation of $2900. In the second neighborhood, 10 randomly selected households have a mean income of $51,200 with a standard deviation of $2225. At α=0.01, can you reject the real estate agent’s claim? Assume the population variances are equal.
Problem 8.RE.8
In Exercises 5– 8, test the claim about the difference between two population means μ1 and μ2 at the level of significance α. Assume the samples are random and independent, and the populations are normally distributed.
Claim: μ1≠μ2; α=0.05
Population statistics: σ1= 14 and σ2= 15
Sample statistics: x̅1 = 87, n1 = 410, and x̅2= 85, n2= 340
Problem 8.RE.2
In Exercises 1– 4, classify the two samples as independent or dependent and justify your answer.
Sample 1: The weights of 45 oranges
Sample 2: The weights of 40 grapefruits
Problem 8.RE.14
In Exercises 11–16, test the claim about the difference between two population means μ1 and μ2 at the level of significance α. Assume the samples are random and independent, and the populations are normally distributed.
Claim: μ1>= μ2; α=0.01. Assume (σ1)^2 = (σ2)^2
Sample statistics: x̅1= 44.5, s1= 5.85, n1= 17 and x̅2= 49.1, s2= 5.25, n2= 18
Problem 8.RE.15
In Exercises 11–16, test the claim about the difference between two population means μ1 and μ2 at the level of significance α. Assume the samples are random and independent, and the populations are normally distributed.
Claim: μ1≠ μ2; α=0.01. Assume (σ1)^2 = (σ2)^2
Sample statistics: x̅1= 61, s1= 3.3, n1= 5 and x̅2= 55.1, s2= 1.2, n2= 7
Problem 8.RE.6
In Exercises 5– 8, test the claim about the difference between two population means μ1 and μ2 at the level of significance α. Assume the samples are random and independent, and the populations are normally distributed.
Claim: μ1=μ2; α=0.01
Population statistics: σ1= 52 and σ2= 68
Sample statistics: x̅1 = 5595, n1 = 156, and x̅2= 5575, n2= 216