Ch.4 - The Study of Chemical Reactions
Wade - Organic Chemistry 9th Edition
Wade9th EditionOrganic ChemistryISBN: 9780135213728Not the one you use?Change textbook
Chapter 4, Problem 35

Consider the following reaction-energy diagram.

a. Label the reactants and the products. Label the activation energy for the first step and the second step.
b. Is the overall reaction endothermic or exothermic? What is the sign of ΔH°?
c. Which points in the curve correspond to intermediates? Which correspond to transition states?
d. Label the transition state of the rate-limiting step. Does its structure resemble the reactants, the products, or an ­intermediate?

Verified step by step guidance
1
Identify the reactants and products on the reaction-energy diagram. The reactants are at the starting energy level on the left, and the products are at the final energy level on the right.
Label the activation energy (Ea) for the first and second steps. The activation energy is the energy difference between the reactants (or intermediate) and the peak of the transition state for each step.
Determine whether the overall reaction is endothermic or exothermic by comparing the energy levels of the reactants and products. If the products are at a lower energy level than the reactants, the reaction is exothermic, and ΔH° is negative. If the products are at a higher energy level, the reaction is endothermic, and ΔH° is positive.
Identify the intermediates and transition states on the curve. Intermediates are located at the valleys between peaks, while transition states are at the peaks of the energy barriers.
Label the transition state of the rate-limiting step. The rate-limiting step corresponds to the highest energy barrier in the reaction. Determine whether the structure of this transition state resembles the reactants, products, or intermediate based on the Hammond postulate, which states that the structure of the transition state is closer to the species (reactants or products) with which it is energetically closer.

Verified video answer for a similar problem:

This video solution was recommended by our tutors as helpful for the problem above.
Video duration:
6m
Was this helpful?

Key Concepts

Here are the essential concepts you must grasp in order to answer the question correctly.

Reaction Energy Diagram

A reaction energy diagram visually represents the energy changes during a chemical reaction. It typically shows the energy of reactants and products, as well as the energy barriers (activation energies) that must be overcome for the reaction to proceed. The peaks in the diagram correspond to transition states, while valleys represent intermediates or stable states.
Recommended video:
Guided course
06:07
Introduction to free energy diagrams.

Activation Energy

Activation energy is the minimum energy required for a chemical reaction to occur. It is represented in the energy diagram as the height of the energy barrier that reactants must overcome to form products. The activation energy can vary between different steps in a multi-step reaction, influencing the rate at which the reaction proceeds.
Recommended video:
Guided course
06:07
Introduction to free energy diagrams.

Endothermic vs. Exothermic Reactions

Endothermic reactions absorb energy from their surroundings, resulting in products that have higher energy than the reactants, indicated by a positive ΔH°. Conversely, exothermic reactions release energy, leading to products with lower energy than the reactants, reflected by a negative ΔH°. The overall energy change can be determined by comparing the energy levels of reactants and products in the energy diagram.
Recommended video:
Guided course
03:06
1,2 vs. 1,4 products
Related Practice
Textbook Question

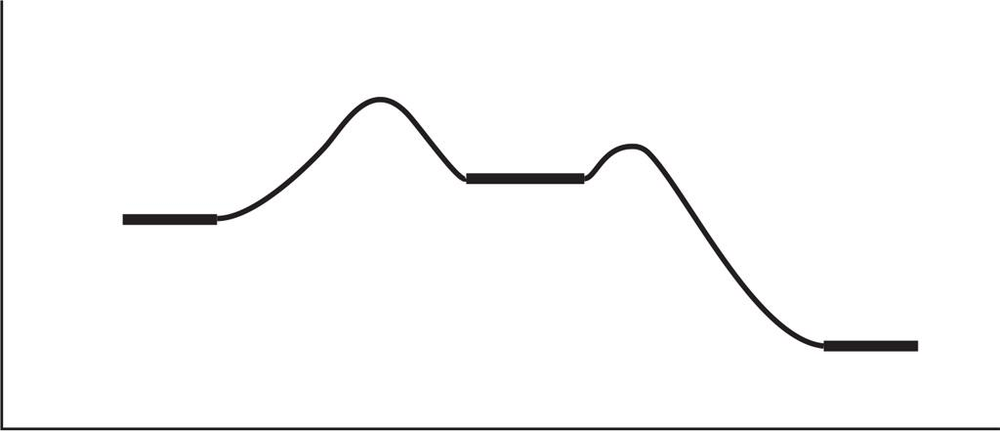
a. Draw an approximate reaction-energy diagram for the acid–base reaction of phenol (see below) with 1-molar aqueous sodium hydroxide solution.

b. On the same diagram, draw an approximate reaction-energy diagram for the acid–base reaction of tert-butyl alcohol (see below) with 1-molar aqueous sodium hydroxide solution.

1079
views
1
rank
Textbook Question

The following reaction is a common synthesis used in the organic chemistry laboratory course.

When we double the concentration of methoxide ion (CH3O), we find that the reaction rate doubles. When we triple the concentration of 1-bromobutane, we find that the reaction rate triples.

a. What is the order of this reaction with respect to 1-bromobutane? What is the order with respect to methoxide ion? Write the rate equation for this reaction. What is the overall order?

1195
views
1
rank
Textbook Question

Draw a reaction-energy diagram for a two-step endothermic reaction with a rate-limiting second step.

1879
views
Textbook Question

Acetonitrile (CH3C≡N) is deprotonated by very strong bases. Write resonance forms to show the stabilization of the carbanion that results.

1994
views
Textbook Question

When it is strongly heated, ethyl diazoacetate decomposes to give nitrogen gas and a carbene. Draw a Lewis structure of the carbene.

1483
views
Textbook Question

Draw a reaction-energy diagram for a one-step exothermic reaction. Label the parts that represent the reactants, products, transition state, activation energy, and heat of reaction.

2603
views