

 05:02
05:02

Textbook Question
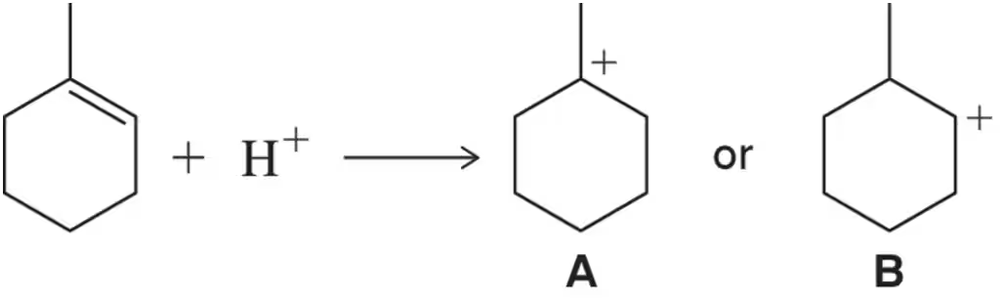
(a) Rank the following carbocations from least stable to most stable. (b) Which would you expect to form first? (c) Which would you expect to react most quickly with a bromide ion (Br⁻) ? [Carbocations, like radicals, are electron deficient.]
1306
views