Back
BackProblem 5.3.51
Definite integrals Evaluate the following integrals using the Fundamental Theorem of Calculus
∫₁⁴ (𝓍 ― 2)/√𝓍 d𝓍
Problem 5.3.5
The linear function ƒ(𝓍) = 3 ― 𝓍 is decreasing on the interval [0, 3]. Is its area function for ƒ (with left endpoint 0) increasing or decreasing on the interval [0, 3]? Draw a picture and explain.
Problem 5.5.63
Definite integrals Use a change of variables or Table 5.6 to evaluate the following definite integrals.
∫₁/₃^¹/√³ 4/(9𝓍² + 1) d𝓍
Problem 5.5.80
Variations on the substitution method Evaluate the following integrals.
∫ y²/(y + 1)⁴ dy
Problem 5.5.35
Indefinite integrals Use a change of variables or Table 5.6 to evaluate the following indefinite integrals. Check your work by differentiating.
∫ 𝓍 csc 𝓍² cot 𝓍² d𝓍
Problem 5.2.79
Limits of sums Use the definition of the definite integral to evaluate the following definite integrals. Use right Riemann sums and Theorem 5.1.
∫₀² (2𝓍 + 1) d𝓍
Problem 5.5.20
Indefinite integrals Use a change of variables or Table 5.6 to evaluate the following indefinite integrals. Check your work by differentiating.
∫ [(√𝓍 + 1)⁴ / 2√𝓍 d𝓍
Problem 5.3.23
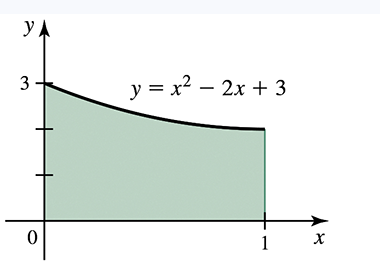
Definite integrals Evaluate the following integrals using the Fundamental Theorem of Calculus. Explain why your result is consistent with the figure.
∫₀¹ (𝓍² ― 2𝓍 + 3) d𝓍
Problem 5.4.31
Average values Find the average value of the following functions on the given interval. Draw a graph of the function and indicate the average value.
ƒ(𝓍) = 𝓍ⁿ on [0,1] , for any positive integer n
Problem 5.4.23
Symmetry in integrals Use symmetry to evaluate the following integrals.
∫²₋₂ [(x³ ― 4x) / (x² + 1)] dx
Problem 5.4.25
Average values Find the average value of the following functions on the given interval. Draw a graph of the function and indicate the average value.
ƒ(𝓍) = 𝓍³ on [―1, 1]
Problem 5.5.57
Definite integrals Use a change of variables or Table 5.6 to evaluate the following definite integrals.
∫π/₄^π/² (cos 𝓍) / (sin² 𝓍) d𝓍
Problem 5.2.87
Area by geometry Use geometry to evaluate the following integrals.
∫⁴₋₆ √(24 ― 2𝓍 ― 𝓍²) d𝓍
Problem 5.2.81
Limits of sums Use the definition of the definite integral to evaluate the following definite integrals. Use right Riemann sums and Theorem 5.1.
∫₃⁷ (4𝓍 + 6) d𝓍
Problem 5.4.39
Mean Value Theorem for Integrals Find or approximate all points at which the given function equals its average value on the given interval.
ƒ(𝓍) = 8 ― 2𝓍 on [0, 4]
Problem 5.5.36
Indefinite integrals Use a change of variables or Table 5.6 to evaluate the following indefinite integrals. Check your work by differentiating.
∫ sec 4w tan 4w dw
Problem 5.5.81
Variations on the substitution method Evaluate the following integrals.
∫ 𝓍/(∛𝓍 + 4) d𝓍
Problem 5.5.10
Use the given substitution to evaluate the following indefinite integrals. Check your answer by differentiating.
∫ (6𝓍 + 1) √(3𝓍² + 𝓍) d𝓍 , u = 3𝓍² + 𝓍
Problem 5.4.47
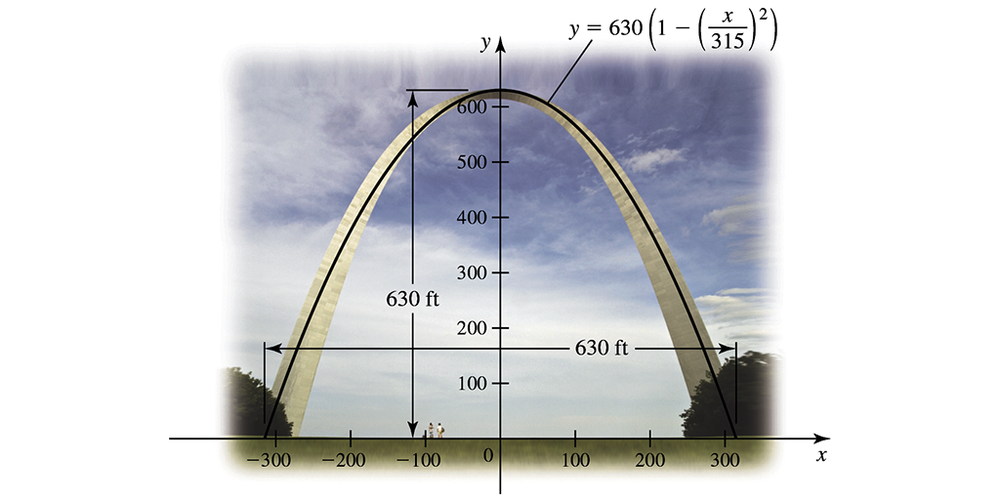
Gateway Arch The Gateway Arch in St. Louis is 630 ft high and has a 630-ft base. Its shape can be modeled by the parabola y = 630 (1― (𝓍/315)²) . Find the average height of the arch above the ground.
Problem 5.1.61
{Use of Tech} Sigma notation for Riemann sums Use sigma notation to write the following Riemann sums. Then evaluate each Riemann sum using Theorem 5.1 or a calculator.
The right Riemann sum for ƒ(𝓍)) = x + 1 on [0, 4] with n = 50.
Problem 5.3.11
Evaluate ∫₃⁸ ƒ ′(t) dt , where ƒ ′ is continuous on [3, 8], ƒ(3) = 4, and ƒ(8) = 20 .
Problem 5.2.37
Identifying definite integrals as limits of sums Consider the following limits of Riemann sums for a function ƒ on [a,b]. Identify ƒ and express the limit as a definite integral.
n
lim ∑ 𝓍*ₖ (ln 𝓍*ₖ) ∆𝓍ₖ on [1,2]
∆ → 0 k=1
Problem 5.4.38
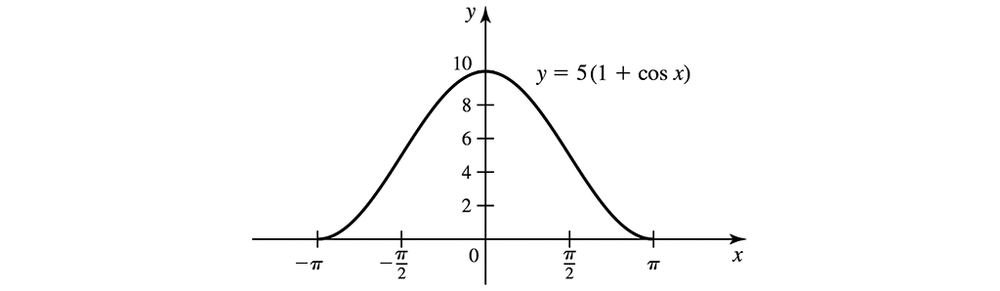
Average height of a wave The surface of a water wave is described by y = 5 (1 + cos 𝓍) , for ― π ≤ 𝓍 ≤ π, where y = 0 corresponds to a trough of the wave (see figure). Find the average height of the wave above the trough on [ ―π , π] .
Problem 5.3.106
{Use of Tech} Areas of regions Find the area of the region 𝑅 bounded by the graph of ƒ and the 𝓍-axis on the given interval. Graph ƒ and show the region 𝑅.
ƒ(𝓍) = 𝓍² (𝓍 ― 2) on [ ―1 , 3]
Problem 5.5.1
On which derivative rule is the Substitution Rule based?
Problem 5.5.23
Indefinite integrals Use a change of variables or Table 5.6 to evaluate the following indefinite integrals. Check your work by differentiating.
∫ 𝓍³ (𝓍⁴ + 16)⁶ d𝓍
Problem 5.1.1
Suppose an object moves along a line at 15 m/s, for 0 ≤ t < 2 and at 25 m/s, for 2 ≤ t ≤ 5, where t is measured in seconds. Sketch the graph of the velocity function and find the displacement of the object for 0 ≤ t ≤ 5.
Problem 5.5.17
Indefinite integrals Use a change of variables or Table 5.6 to evaluate the following indefinite integrals. Check your work by differentiating.
∫ 2𝓍(𝓍² ― 1)⁹⁹ d𝓍
Problem 5.5.79
Variations on the substitution method Evaluate the following integrals.
∫ 𝓍/(√𝓍―4) d𝓍
Problem 5.5.84
Variations on the substitution method Evaluate the following integrals.
∫ (𝒵 + 1) √(3𝒵 + 2) d𝒵